Showing posts with label forex. Show all posts

Thursday, 29 August 2019

Before you can earn you have to learn

Top 7 Books to Learn Technical Analysis


There is a wide range of books available for learning technical analysis, covering topics like chart patterns, crowd psychology, and even trading system development. While many of these books provide outdated or irrelevant information, there are several books that have become timeless masterpieces when it comes to mastering the art of trading.

In this article, we will look at seven books on technical analysis to help traders and investors better understand the subject and employ the strategy in their own trading.


Getting Started in Technical Analysis by Jack Schwager 


This book is an excellent starting point for novice traders that covers every major topic in technical analysis. In addition to covering chart patterns and technical indicators, the book takes a look at how to choose entry and exit points, developing trading systems, and developing a plan for successful trading. These are all key elements to becoming a successful trader and there aren't many books that combine all of this advice into a single book.

Technical Analysis Explained by Martin Pring 

This book is considered by many to be the “Bible” of technical analysis since it contains an exhaustive amount of information covering the core concepts. The book also covers ancillary topics like trading psychology and market mechanics that help traders understand the whyrather than just the how of technical analysis. Despite the wide breadth of knowledge, the book is very approachable and easy to understand for novice traders.

Technical Analysis of the Financial Markets by John Murphy 

This book is an approachable introduction to technical analysis that still provides a high level of detail and actionable insights. As a former technical analyst for CNBC with over 40 years of experience in the market, Mr. Murphy has become a leading voice for technical analysis and is highly skilled at conveying complex topics in an easy to understand manner. Novice traders may want to check out this book before diving into more complex topics.


How to Make Money in Stocks by William O’Neil

This book is considered a classic work on technical analysis and was written by the founder of Investor’s Business Daily, one of the most popular investment publications in the world. O’Neil was a strong advocate for technical analysis, having studied over 100 years of stock price movements in researching the book. In the book, he presents a wide range of technical strategies and tips for minimizing risk and finding entry and exit points.

Japanese Candlestick Charting Techniques by Steve Nison

This book is the definitive volume on candlestick charting, which is one of the most commonly used technical analysis tools. Prior to Nison’s work, candlestick charting was relatively unknown in the West. He helped publicise the technique and train institutional traders and analysts at top investment banking firms. The book offers a thorough explanation of the subject, including explanations of virtually all candlestick patterns that are used by traders today.

Encyclopaedia of Chart Patterns by Thomas Bulkowski 


This book is truly an encyclopedia that contains an exhaustive list of chart patterns a statistical overview of how they have performed in predicting future price movements. Mr. Bulkowski is a well-known chartist and technical analyst and his statistical analysis sets the book apart from others that simply show chart patterns and how to spot them. The updated version of the book includes a section on event trading and patterns that occur with news releases.


Technical Analysis Using Multiple Timeframes by Brian Shannon 

This book has a wide appeal for technical traders because it can be helpful to traders regardless of the strategy that they use. The book highlights the value of applying technical analysis across multiple timeframes to identify trades with the highest probability of success. It also goes well beyond what its title implies and covers subjects including short selling, stop-loss order placement, price target identification, and related topics.


There are more than 10,000 books on technical analysis available to traders, but these seven stand out.


The Bottom Line 

There have been many books written on technical analysis, but some of them have become timeless classics that are invaluable to traders. Those new to technical analysis may want to check out these books to fine-tune their strategies and maximise their odds of success.

Written by 


Wednesday, 10 July 2019

Trading in the Zone

Wealth Wednesdays 

This book has been recommended to me by more than one of my mentors over the past few years. Having read it, I agree it is invaluable. 

Being a successful trader means accepting winning and losing trades, and for those with a fear of failure (like me) this isn't always easy to accept. 

Not to sound all philosophical, but so much of trading is about balance. You accept the balance between winning and losing trades, have to keep your emotions balanced, have to balance your risk management and you must have a balanced portfolio at any given time (i.e. having short and long trades, in similar forex pairs or within the same market if you are trading stocks). A balanced portfolio is critical - if a sudden political announcement was made and all your long trades went short, you would want a few trades that were short and therefore save your account. 

Trading in the zone, writes about trading psychology and maintaining this balance much more succinctly than me. Definitely worth a read. 


Saturday, 15 June 2019

How to use Fibonacci in trading....


Fibonacci explained and some examples of how to apply it, in your trading.
Personally I find Fibonacci more useful in planning my target, rather than as a criteria to enter a trade

Monday, 19 November 2018

Weekly FX insights

This week we’ll begin with our monthly and weekly forecasts of the currency pairs worth watching. The first part of our forecast is based upon our research of the past 16 years of Forex prices, which show that the following methodologies have all produced profitable results:
  • Trading the two currencies that are trending the most strongly over the past 3 months.
  • Assuming that trends are usually ready to reverse after 12 months.
  • Trading against very strong counter-trend movements by currency pairs made during the previous week.
  • Buying currencies with high interest rates and selling currencies with low interest rates.
Let’s take a look at the relevant data of currency price changes and interest rates to date, which we compiled using a trade-weighted index of the major global currencies:
TABLE01

Monthly Forecast November 2018

For the month of November, we forecasted that the best trade would be short EUR/USD. The performance to date is as follows:
TABLE02

Weekly Forecast 18th November 2018 

Last week, we made no forecast as there was no strong counter-trend moves.
This week, we again make no weekly forecast.
Less than 44% of the important currency pairs or crosses moved by more than 1% in value over the past week. This volatility is increasing, but we expect it is likely to decrease again the coming week.
This week has been dominated by relative strength in the New Zealand Dollar, and relative weakness in the British Pound.
You can trade our forecasts in a real or demo Forex brokerage account.

Key Support/Resistance Levels for Popular Pairs

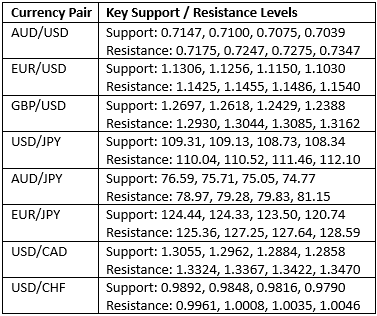
We teach that trades should be entered and exited at or very close to key support and resistance levels. There are certain key support and resistance levels that should be watched on the more popular currency pairs this week, which might result in either reversals or breakouts:
TABLE12

AUD/USD

Let’s see how trading two of these key pairs last week off key support and resistance levels could have worked out:
We had expected the level at 0.7165 might act as support, as it had acted previously as both support and resistance. Note how these “flipping” levels can work well. The H1 chart below shows the how the price rejected this level right at the Tokyo open last Tuesday, marked by the up arrow in the price chart below, forming a bullish pin candlestick which broke up right away. This is often a great time of day to enter trades involving Asian currencies such as the Australian Dollar, and such candlesticks are often useful indicators of reversals when their wicks or the wick of the structure rejects key levels. This trade was been profitable so far, achieving a maximum positive reward to risk ratio of slightly less than 10 to 1.
AUDUSD

USD/CHF

We had expected the level at 1.0110 might act as resistance, as it had acted previously as both support and resistance. Note how these “flipping” levels can work well. The H1 chart below shows the how the price rejected this level early in the London session last Tuesday, marked by the down arrow in the price chart below, forming a bearish pin candlestick which broke down right away. This is often a great time of day to enter trades involving European currencies such as the Swiss Franc, and such candlesticks are often useful indicators of reversals when their wicks or the wick of the structure rejects key levels. This trade was been profitable so far, achieving a maximum positive reward to risk ratio so far of a little more than 5 to 1.

Wednesday, 14 November 2018

How many trades do you need to win to make a profit?

Let me get it out of the way: the winrate in trading it completely irrelevant on its own. Many traders put way too much emphasis on the winrate and do not understand that a winrate does not tell you anything about the quality of a system or a trader.
You can lose money with a 80% or even with a 90% winrate if your few losers are so big that they wipe out your winners. On the other hand, you can have a profitable system even with a winrate of 50%, 40% or onl 30% if you are good at letting winners run and cutting losses short.
It all comes down to your reward risk ratio.
The reward to risk ratio (RRR, or reward risk ratio) is maybe the most important metric in trading and a trader who understands the RRR can improve his chances of becoming profitable.

Independent trader, James Booth, explains more...


Source: https://www.tradeciety.com/how-to-use-reward-risk-ratio-guide/

Thursday, 8 November 2018

Candlestick patterns


Video that has been described as 'liquid gold'......

What do you think, is this video worth its time in gold?

The Introductory Guide to Non-Farm Payrolls (NFP)

Non-farm payrolls data releases are influential on both economic policy and financial markets. Discover what non-farm payrolls are, the upco...