Showing posts with label day trading. Show all posts

Thursday, 29 August 2019

Before you can earn you have to learn

Top 7 Books to Learn Technical Analysis


There is a wide range of books available for learning technical analysis, covering topics like chart patterns, crowd psychology, and even trading system development. While many of these books provide outdated or irrelevant information, there are several books that have become timeless masterpieces when it comes to mastering the art of trading.

In this article, we will look at seven books on technical analysis to help traders and investors better understand the subject and employ the strategy in their own trading.


Getting Started in Technical Analysis by Jack Schwager 


This book is an excellent starting point for novice traders that covers every major topic in technical analysis. In addition to covering chart patterns and technical indicators, the book takes a look at how to choose entry and exit points, developing trading systems, and developing a plan for successful trading. These are all key elements to becoming a successful trader and there aren't many books that combine all of this advice into a single book.

Technical Analysis Explained by Martin Pring 

This book is considered by many to be the “Bible” of technical analysis since it contains an exhaustive amount of information covering the core concepts. The book also covers ancillary topics like trading psychology and market mechanics that help traders understand the whyrather than just the how of technical analysis. Despite the wide breadth of knowledge, the book is very approachable and easy to understand for novice traders.

Technical Analysis of the Financial Markets by John Murphy 

This book is an approachable introduction to technical analysis that still provides a high level of detail and actionable insights. As a former technical analyst for CNBC with over 40 years of experience in the market, Mr. Murphy has become a leading voice for technical analysis and is highly skilled at conveying complex topics in an easy to understand manner. Novice traders may want to check out this book before diving into more complex topics.


How to Make Money in Stocks by William O’Neil

This book is considered a classic work on technical analysis and was written by the founder of Investor’s Business Daily, one of the most popular investment publications in the world. O’Neil was a strong advocate for technical analysis, having studied over 100 years of stock price movements in researching the book. In the book, he presents a wide range of technical strategies and tips for minimizing risk and finding entry and exit points.

Japanese Candlestick Charting Techniques by Steve Nison

This book is the definitive volume on candlestick charting, which is one of the most commonly used technical analysis tools. Prior to Nison’s work, candlestick charting was relatively unknown in the West. He helped publicise the technique and train institutional traders and analysts at top investment banking firms. The book offers a thorough explanation of the subject, including explanations of virtually all candlestick patterns that are used by traders today.

Encyclopaedia of Chart Patterns by Thomas Bulkowski 


This book is truly an encyclopedia that contains an exhaustive list of chart patterns a statistical overview of how they have performed in predicting future price movements. Mr. Bulkowski is a well-known chartist and technical analyst and his statistical analysis sets the book apart from others that simply show chart patterns and how to spot them. The updated version of the book includes a section on event trading and patterns that occur with news releases.


Technical Analysis Using Multiple Timeframes by Brian Shannon 

This book has a wide appeal for technical traders because it can be helpful to traders regardless of the strategy that they use. The book highlights the value of applying technical analysis across multiple timeframes to identify trades with the highest probability of success. It also goes well beyond what its title implies and covers subjects including short selling, stop-loss order placement, price target identification, and related topics.


There are more than 10,000 books on technical analysis available to traders, but these seven stand out.


The Bottom Line 

There have been many books written on technical analysis, but some of them have become timeless classics that are invaluable to traders. Those new to technical analysis may want to check out these books to fine-tune their strategies and maximise their odds of success.

Written by 


Sunday, 11 August 2019

Day Trading vs Swing Trading

The time frame on which a trader opts to trade can have a significant impact on trading strategy and profitability. Day traders open and close multiple positions within a single day, while swing traders take trades that last multiple days, weeks or even months. These two different trading styles can suit various traders depending on the amount of capital available, time availability, psychology and the market being traded.

One trading style isn't better than another and it really comes down to which style suits a trader's personal circumstances. Some traders opt to do one or the other, while others may be day traders, swing traders, and buy-and-hold investors all at once.

Day Trading Versus Swing Trading: Potential Returns
Day trading attracts traders looking for rapid compounding of returns. Assume a trader risks 0.5 percent of her capital on each trade. If she loses, she'll lose 0.5 percent, but if she wins she'll make 1 percent (2:1 reward-to-risk ratio).

Also, assume she wins 50 percent of her trades. If she makes six trades per day, on average, she will be adding about 1.5 percent to her account balance each day, less trading fees. Making even 1 percent a day would grow a trading account by more than 200 percent over the course of the year, uncompounded.

On the flip side, while the numbers seem easy to replicate for huge returns, nothing's ever that easy. Making twice as much on winners as you lost on losers, while also winning 50 percent of all the trades you take, doesn't come easily. You can make quick gains, but you can also rapidly deplete your trading account through day trading.

Swing trading accumulates gains and losses more slowly than day trading, but you can still have certain swing trades that quickly result in big gains or losses. Assume a swing trader uses the same risk management rule and risks 0.5 percent of his capital on each trade with a goal of trying to make 1 percent to 2 percent on his winning trades.

Assume he earns 1.5 percent on average for winning trades, losing 0.5 percent on losing trades. He makes six trades per month and wins 50 percent of those trades. In a typical month, the swing trader could make 3 percent on his account balance, less fees. Over the course of the year, that comes out to about 36 percent, which sounds good but offers less potential than a day trader's possible earnings.

These example scenarios serve to illustrate the distinction between the two trading styles. Altering the percentage of trades won, the average win compared to average loss, or the number of trades, will drastically affect a strategy's earning potential.
As a general rule, day trading has more profit potential, at least on smaller accounts. As the size of the account grows it becomes harder and harder to effectively utilize all the capital on very short-term day trades.

Day traders may find their percentage returns decline the more capital they have. Their dollar returns may still go up, since making 5 percent on $1 million equates to much more than 20 percent on $100,000. Swing traders have less chance of this happening.

Varying Capital Requirements
Capital requirements vary according to the market being trading. Day trading and swing traders can start with differing amounts of capital depending on whether they trade the stock, forex or futures market.

Day trading stocks in the US requires an account balance of at least $25,000. No legal minimum exists to swing trade stocks, although a swing trader will likely want to have at least $10,000 in their account, and preferably $20,000 if looking to draw an income from trading.

To day trade the forex market, no legal minimum exists, but it is recommended that traders start with at least $500, but preferably $1,000 or more. To swing trade forex, the minimum recommended is about $1,500, but preferably more. This amount of capital will allow you to enter at least a few trades at one time.


To day trade futures, start with at least $5,000 to $7,500, and more capital would be even better. These amounts depend on the futures contract being traded. Day trading some contracts could require much more capital, while a few contracts, such as micro contracts, may require less.

To swing trade a variety of futures contracts, you need at least $10,000, and likely $20,000 or more. The amount needed depends on the margin requirements of the specific contract being traded.

Trading Times Differ
Both day trading and swing trading require time, but day trading typically takes up much more time. Day traders usually trade for at least two hours per day. Adding on preparation time and chart/trading review means spending at least three to four hours at the computer, at a minimum. If a day trader opts to trade for more than a couple hours a day, the time investment goes up considerably and it becomes a full-time job.

Swing trading, on the other hand, can take much less time. For example, if you're swing trading off a daily chart, you could find new trades and update orders on current positions in about 45 minutes a night. These activities may not even be required on a nightly basis.


Some swing traders, taking trades that last weeks or months, may only need to look for trades and update orders once a week, bringing the time commitment down to about an hour per week instead of per night, or updating orders may not even be required on a nightly basis. 

You must also do day trading while a market is open and active. The most effective hours for day trading are limited to certain periods of the day. If you can't day trade during those hours, then choose swing trading as a better option. Swing traders can look for trades or place orders at any time of day, even after the market has closed.

Swing traders are less affected by the second-to-second changes in the price of an asset. They focus on the bigger picture, typically looking at daily charts, so placing trades after the market closes on a particular day works just fine. Day traders make money off second-by-second movements, so they need to be involved while the action is happening.

Focus, Time and Practice
Swing trading and day trading both require a good deal of work and knowledge to generate profits consistently, although the knowledge required isn't necessarily "book smarts." Successful trading results from finding a strategy that produces an edge, or a profit over a significant number of trades, and then executing that strategy over and over again.

Some knowledge on the market being traded and one profitable strategy can start generating income, along with lots and lots of practice. Each day prices move differently than they did on the last, which means the trader needs to be able to implement his strategy under various conditions and adapt as conditions change.

This presents a difficult challenge, and consistent results only come from practicing a strategy under loads of different market scenarios. That takes time and should involve making hundreds of trades in a demo account before risking real capital.

Choosing day trading or swing trading also comes down to personality. Day trading typically involves more stress, requires sustained focus for extended periods of time and takes incredible discipline. People that like action, have fast reflexes, and/or like video games and poker tend to gravitate toward day trading.

Swing trading happens at a slower pace, with much longer lapses between actions like entering or exiting trades. It can still be high stress, and also requires immense discipline and patience.

It doesn't require as much sustained focus, so if you have difficulty staying focused, swing trading may be the better option. Fast reflexes don't matter in swing trading as trades can be taken after the market closes and prices have stopped moving.

Day trading and swing trading both offer freedom in the sense that a trader is his own boss. Traders typically work on their own and responsible for funding their accounts and for all losses and profits generated. One can argue that swing traders have more freedom in terms of time because swing trading takes up less time than day trading.

A Final Comparison
One trading style isn't better than the other; they just suit differing needs. Day trading has more profit potential, at least in percentage terms on smaller-sized trading accounts. Swing traders have a better chance of maintaining their percentage returns even as their account grows, up to a certain point.

Capital requirements vary quite a bit across the different markets and trading styles. Day trading requires more time than swing trading, while both take a great deal of practice to gain consistency. Day trading makes the best option for the action lovers. Those seeking a lower-stress and less time-intensive option can embrace swing trading.

By Cory Mitchell


Tuesday, 2 July 2019

Traders Tuesday!

This is a great video on developing your own trading strategies. Trading strategies can be based on indicators with a strict set of rules, or newer strategies such as mechanical strategies, which take human interpretation out of trading. 

Later this week I’ll be sharing my personal excel sheet that I use for backtesting and to record live trades (which a short webinar on how to use it). Safe trading!


Saturday, 15 June 2019

How to use Fibonacci in trading....


Fibonacci explained and some examples of how to apply it, in your trading.
Personally I find Fibonacci more useful in planning my target, rather than as a criteria to enter a trade

Friday, 14 June 2019

Turning your weekend into a financial resource

Some people hate working on the weekends but I love it, in fact, I look forward to it, here’s why…
As a trader, I know it’s critically important that I am as prepared as possible for the upcoming trading week, and I have learned over my 15+ years in the market that the best time to do my market analysis and make trading decisions, is when the markets are closed.
Of course, what I just described is the opposite of what most traders do; frantically checking the charts throughout the day during the week, hoping or praying and ultimately making terrible choices about when to enter and exit the market. Whereas, if they would just learn how to do their market analysis on the weekends and take the rest of the week off, they would not have to hope or pray because they would be strategically preempting their decisions and actions in the market with logic and objectivity.
Now, I may be exaggerating slightly with “take the rest of the week off”, but what I mean is, most of your time spent in front of the charts should be on the weekend. During the week, I will monitor the market lightly each day, maybe 10 to 15 minutes at the start and end of the day. If there is something to do that meshes with my weekend-analysis, I will place the orders and walk the hell away from the charts until tomorrow. I DO NOT want to be consumed by the market or constantly staring at charts, instead, I want to be out enjoying the fruits of my craft (because being a trader rocks). By the way, being out and enjoying your life will have the unintended benefit of helping you improve your trading results, because as I’ve discussed in-depth in an article on why you shouldn’t watch your trades, the less involved you are with your trades, the better your trading performance is likely to be.

What is weekend market analysis?

So, what does my weekend analysis look like? What do I ACTUALLY do, you might be wondering. I am going to explain it to you then show you on the charts later on…
First off, 95% of my market analysis is done on the weekend and takes place on the weekly and daily chart time frame (I will explain more on this later). It’s no big secret, what I am doing is basically looking for key chart levels of support and resistance, swing highs and lows, event areas and daily chart price action signals (See linked terms if you are unsure what any of these things are).
Essentially, what I am doing is reading the story on the chart and mapping the market from left to right. I am reading what has happened, what is happening and making a final decision of what I think might happen next (the upcoming week). I want to have all my key levels drawn in, my bias (bullish or bearish) written out along with the chart condition (uptrend, downtrend, large sideways range or tight / choppy consolidation) as well as taking note of any imminent trade setups that I am looking at.

WHY you should do your trading analysis on the weekends:

Before I get into the step-by-step breakdown of how I analyze the markets on the weekend, I want to make sure you know why this concept is so powerful so you that you start putting it into practice and reaping the benefits of it as soon as possible:
First off, end of week and end of day analysis obviously saves a lot of time compared to day trading, allowing us to truly enjoy the fruits of our craft, but this is not the main reason I do my analysis this way, not by a long-shot…
You see, the end of the week means something in the market. In fact, it’s very importantbecause it shows an entire 5 days or 1 week of trading in the market, showing who won the battle between bulls and bears that week. The market will have shown part of its hand at week’s close and there is far more weight behind where the market closes on a Friday compared to any other day of the week.
Note: This doesn’t mean “weekly chart trading”, it means END OF THE WEEK analysis; identifying the key levels and trend and if any trade signals formed over the previous week. In other words, using the weekly and daily chart to get the complete picture and then develop your approach from that.
Another big reason why this end-of-week analysis approach works so well is that it contributes to a low frequency trading approach, something I have written about quite extensively in various lessons over the years.
When you trade less, it improves your trading performance over the long-run, and there are many studies that show this. This is partially why the data shows that women make better traders than men; because they trade less frequently than men do as I explained in my recent article What is the weakest link in your trading?
The market is slower than we think, meaning good trades take time to play out, and over time you will agree. You look back at trades you were in and think, “I should have held that longer”. This hindsight regret should teach you to hold trades longer and have some faith in your analysis. The end of week analysis will help you, and the end of day entries will further boost your performance and clarity, here is how I do my analysis….

Here is a summary version of my trading routine 

My weekly and daily trading routine is a lot less complicated than you probably think. First off, as I’ve written about in a recent article on the power of trading routines, the most important thing to remember here is that all of this has become a HABIT for me. The routine of writing my weekly market commentary, which I started back in 2008, still helps me after all these years.
You must develop the proper trading habits if you want to become a successful trader, as in any other profession.
The discussion that follows is basically a step-by-step explanation of how I create my weekly members market outlook, which, coincidentally, was something I was doing BEFORE I ever had any students. It should go without saying that this is something you should be doing too; creating your own weekly market outlook will provide you with a ‘road map’ to the market each week that will help guide you in making trade decisions in the ‘heat of the moment’. Just as a general in war preempts his strategy, so you must preempt your trading strategy so that you are not making impulsive decisions in the middle of a heated market move. Therefore, you often see me write in my market commentaries something like, “We will do this if this happens this week, or bullish above this level, wait for this to do that and to monitor XYZ level, etc”…I am laying out a road map so that you can preempt your trading week rather than making decisions in the ‘heat of battle’…
Step 1.
The very first thing you should know is that I don’t look at every Forex pair, not even close. I have a select number of my favorite Forex currency pairs that I follow and these are the ones I have open on my MetaTrader 4 trading platform (sign up with AVAtrader today http://tiny.cc/awardwinningbroker) and I really don’t look at any other ones. I do, of course, trade other markets, like Gold, Oil and several Stock Indices, but I am not trying to analyze and follow 30 different markets each week as many traders do, so keep that in mind.
The first thing I do is open my charts and look at the weekly time frame to plot the key levels and to get a good bird’s eye view of the long-term market trend. In the chart example below, I have drawn in the key support and resistance levels and I’ve marked on the chart the obvious overall trend of the market, so you can see what I am thinking when I look at it. It’s important to know what the current long-term market condition is (trending up or down, sideways etc.), in this case the long-term trend is up, as we can see below. This fact, along with the key levels you plotted, will work to guide your trading decisions throughout the upcoming week, as we will see later…
Here’s another example…
Step 2.
The next thing I do after having analyzed the weekly chart as discussed in Step 1, is to drill-down to the daily chart time frame, where we will do a few different things…
  1. We are drawing in any obvious support or resistance levels that perhaps were not obvious on the weekly chart.
  2. We are identifying the near-term daily chart trend, so we can decide which direction we will look to trade for the upcoming week (this can be different than the weekly trend).
  3. Scan for any obvious price action signals for potential trade entries.
Here’s how it looks on the daily chart of the same EURUSD weekly chart in the first image above…
Note: If the daily chart is sideways, always refer up to the weekly chart for which direction you should look to trade in. So, if the daily chart is sideways or range-bound, but the weekly chart is in a long-term uptrend, then look to trade long. In the chart above, the trend was recently sideways but now is showing signs of switching to a downtrend following the recent close under support near 1.1660 – 1.1620.
Here is the GBPUSD daily chart that follows the GBPUSD weekly chart view from Step 1. Notice, we have drawn in a near-term support zone that wasn’t visible on the weekly and we have marked a potential pin bar signal trade which we discussed in our recent weekly trade outlook.


Note: If there are daily / weekly signals there from the Friday’s close, then we plan a trade for the Monday of the next week, and if there isn’t just yet then we WAIT for the daily chart to show us something that following week. Also, the entries are all triggered by end of day on the daily chart, we aren’t taking weekly chart signals. But, if a weekly chart price action signal did form the previous week, that WOULD CERTAINLY influence our approach and decisions on the daily and even 4 hour or 1 hour chart for that next week.

Conclusion

This article has given you a glimpse into how I do my weekly market analysis on the weekends. I hope now you can see that market analysis is actually not all that difficult, you really just need to make it into a routine so that routine develops into a habit.

Written by: Nial Fuller

Monday, 19 November 2018

Weekly FX insights

This week we’ll begin with our monthly and weekly forecasts of the currency pairs worth watching. The first part of our forecast is based upon our research of the past 16 years of Forex prices, which show that the following methodologies have all produced profitable results:
  • Trading the two currencies that are trending the most strongly over the past 3 months.
  • Assuming that trends are usually ready to reverse after 12 months.
  • Trading against very strong counter-trend movements by currency pairs made during the previous week.
  • Buying currencies with high interest rates and selling currencies with low interest rates.
Let’s take a look at the relevant data of currency price changes and interest rates to date, which we compiled using a trade-weighted index of the major global currencies:
TABLE01

Monthly Forecast November 2018

For the month of November, we forecasted that the best trade would be short EUR/USD. The performance to date is as follows:
TABLE02

Weekly Forecast 18th November 2018 

Last week, we made no forecast as there was no strong counter-trend moves.
This week, we again make no weekly forecast.
Less than 44% of the important currency pairs or crosses moved by more than 1% in value over the past week. This volatility is increasing, but we expect it is likely to decrease again the coming week.
This week has been dominated by relative strength in the New Zealand Dollar, and relative weakness in the British Pound.
You can trade our forecasts in a real or demo Forex brokerage account.

Key Support/Resistance Levels for Popular Pairs

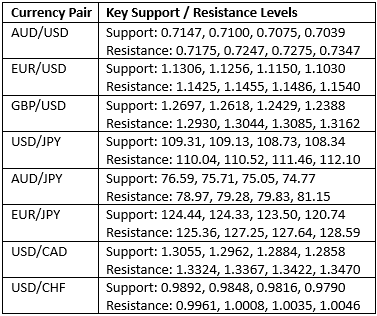
We teach that trades should be entered and exited at or very close to key support and resistance levels. There are certain key support and resistance levels that should be watched on the more popular currency pairs this week, which might result in either reversals or breakouts:
TABLE12

AUD/USD

Let’s see how trading two of these key pairs last week off key support and resistance levels could have worked out:
We had expected the level at 0.7165 might act as support, as it had acted previously as both support and resistance. Note how these “flipping” levels can work well. The H1 chart below shows the how the price rejected this level right at the Tokyo open last Tuesday, marked by the up arrow in the price chart below, forming a bullish pin candlestick which broke up right away. This is often a great time of day to enter trades involving Asian currencies such as the Australian Dollar, and such candlesticks are often useful indicators of reversals when their wicks or the wick of the structure rejects key levels. This trade was been profitable so far, achieving a maximum positive reward to risk ratio of slightly less than 10 to 1.
AUDUSD

USD/CHF

We had expected the level at 1.0110 might act as resistance, as it had acted previously as both support and resistance. Note how these “flipping” levels can work well. The H1 chart below shows the how the price rejected this level early in the London session last Tuesday, marked by the down arrow in the price chart below, forming a bearish pin candlestick which broke down right away. This is often a great time of day to enter trades involving European currencies such as the Swiss Franc, and such candlesticks are often useful indicators of reversals when their wicks or the wick of the structure rejects key levels. This trade was been profitable so far, achieving a maximum positive reward to risk ratio so far of a little more than 5 to 1.

The Introductory Guide to Non-Farm Payrolls (NFP)

Non-farm payrolls data releases are influential on both economic policy and financial markets. Discover what non-farm payrolls are, the upco...